
Banks now lend $1.80 trillion to other lenders. Loans to nondepository financial institutions (NDFIs) — mortgage companies, private credit and business development companies, private equity funds, consumer finance companies and other nonbanks — are 12.7% of all bank loans, up from 0.8% when the Call Report first broke them out in 2010, and they are growing three times as fast as bank lending overall. This is our first report on the category. Using data through September 30, 2026, for the 627 banks with NDFI loans, we find:
- Growth is real, but the headline overstates it. NDFI loans rose 22.8% in the year to 3Q26, against 7.5% for all loans. Of the $897 billion added since 3Q24, roughly $324 billion came from new reporting rules in 4Q24, not new lending (Chart 1).
- It is a large-bank business. The banks of the eight U.S. G-SIBs hold 64% of the total and banks of $100 billion and over hold 89%. The ten largest lenders hold 74%. But exposure relative to capital & reserves is rising across the industry: 36 banks now have a concentration in NDFIs amounting to more than their tier 1 capital plus allowance, up from 32 a year ago (Chart 2).
- Fund and private-credit lending is driving it. Loans to business credit intermediaries ($467 billion) and private equity funds ($437 billion) have each more than doubled since 4Q24 (Chart 3).
- Credit is still clean, with only the first signs of deterioration. Only 0.07% of NDFI loans are noncurrent, against 0.93% of all loans, and NDFI formation of 0.24% annualized is a fifth of the rate for all loans. But 30–89 day delinquencies rose to 0.06% from 0.04% a year ago, and 3Q26 formation rose from 0.14% (Charts 4 and 5).
- Banks appear to reserve NDFI loans at about a third of the rate of other commercial loans. Banks do not report an allowance for NDFI loans, but their allowance on commercial loans falls from 1.52% where they hold no NDFI loans to 0.64% where NDFI loans are more than half of the book, consistent with an NDFI reserve rate near 0.4% (Chart 6). Our ACL model asks for $9.9 billion, 0.55% of NDFI loans (Chart 7).
How We Measure
NDFI loans represent credit extended to lenders and investment vehicles that are not banks, such as warehouse lines to mortgage companies, credit facilities to business development companies and private credit funds, subscription and capital-call lines to private equity funds, and lines to consumer finance and fintech lenders. We also analyze unused commitments to NDFIs and NDFI loans that are past due or on nonaccrual. Also, banks with more than $10 billion of assets report the loans by five borrower types.
What you will find in our analysis is the size of the book against capital & reserves, the stock of problem loans, and the formation rate, which represents the annualized flow of performing loans that became problem loans in the quarter (the change in 90+ day and nonaccrual loans, plus chargeoffs1, nonaccrual loans sold and modifications to borrowers in difficulty, over opening performing loans). We then compare what banks hold in reserve with what our ACL model would require.
A Short History of the Category
Banks have always lent to other lenders. Warehouse lines to mortgage bankers, lines to finance companies and loans to securities firms are old products. What changed after 2008 is where the risk sits. Higher capital charges on riskier direct loans, stress testing and supervisory guidance on leveraged lending moved a large share of mortgage origination, middle-market corporate lending and consumer lending to nonbanks. Banks followed the loans out: rather than lending to the borrower directly, they lend to the nonbank that does, senior and secured against a diversified pool, with lower capital and, historically, very low losses.
The Call Report began reporting these loans on their own line in 2010, when banks held $56 billion. They grew 21% a year from then to 3Q24, five times the 4.2% growth of all loans, reaching $491 billion at the end of 2019 and $900 billion in 3Q24 (Chart 1). The growth came in waves: private credit funds and business development companies after 2014, nonbank mortgage lenders as banks retreated from mortgage origination and servicing, and capital-call lines to private equity funds through the 2020–2021 fundraising boom.
In 4Q24 the banking agencies added the detail that makes this report possible: the five borrower types, unused commitments and past-due and nonaccrual loans. They also clarified which loans belong on the line. Banks moved loans to nonbank lenders out of commercial and industrial loans and "all other loans": on a domestic-office basis, NDFI loans rose $346 billion from 3Q24 to 2Q25 while C&I loans fell $86 billion and other loans $123 billion. In the same quarter, banks with foreign offices began reporting the line on a consolidated basis, which added $116 billion. The step in Chart 1 at 4Q24 is mostly reporting.
Attention to the category rose sharply in the autumn of 2025. In September Tricolor Holdings, a subprime auto lender, went into Chapter 7 liquidation, and First Brands Group, an auto-parts supplier financed heavily by nonbanks, filed for Chapter 11. In October Zions Bancorporation charged off $50 million on two loans after finding apparent misrepresentations by its borrowers, and Western Alliance Bancorporation sued a borrower, alleging fraud. Both had lent to affiliated investment funds that bought commercial mortgage loans. Investors began to ask what else sat inside the line. The reported numbers have so far stayed small, as the credit sections below show. What has not stopped is the growth.
Chart 1: Loans to NDFIs, All Banks, 1Q10 to 3Q26 ($ billions and % of total loans)
Who Lends, and How Much Against Capital & Reserves
NDFI lending is concentrated. The five largest lenders hold 56% of the industry total, the ten largest 74% and the 25 largest 89%. The 65 banks with more than $1 billion of NDFI loans hold 98%. At the G-SIB banks NDFI loans are 21.4% of all loans, and the median G-SIB bank lends about as much to NDFIs as its tier 1 capital plus allowance (Table 1).
Measured against capital & reserves, exposure is rising at the median bank and in the tail. Among the 627 banks with NDFI loans, the median bank's NDFI loans were 7.5% of tier 1 capital plus allowance in 3Q26, up from 6.3% a year earlier, and the 80th-percentile bank's 32.6%, up from 26.0% (Chart 2). 157 banks have NDFI loans above a quarter of their capital & reserves, up from 129, and 36 above all of it. Some of these are specialists: warehouse lenders, banks that serve broker-dealers and fund managers, and bankers' banks. For them a large NDFI book is the business, not drift.
Chart 2: NDFI Loans as % of Tier 1 Capital Plus Allowance, Banks With NDFI Loans, 4Q12 to 3Q26
Table 1: Loans to NDFIs by Bank Size, 3Q26
| Bank group | Banks with NDFI loans | NDFI loans ($B) | Share of industry NDFI loans | NDFI loans as % of total loans | NDFI loan growth, 4 quarters | Median bank: NDFI loans as % of tier 1 + allowance | Banks with NDFI loans above tier 1 + allowance | NDFI noncurrent rate | NDFI formation rate, annualized | Cybiont model NDFI reserve requirement ($B) |
|---|---|---|---|---|---|---|---|---|---|---|
| All banks | 627 | 1,796.5 | 100.0% | 12.7% | +23% | 7.5% | 36 | 0.07% | 0.24% | 9.88 |
| G-SIB banks | 10 | 1,146.6 | 63.8% | 21.4% | +23% | 100.7% | 5 | 0.04% | 0.14% | 5.58 |
| $100 billion and over | 32 | 1,603.2 | 89.2% | 17.3% | +25% | 68.5% | 8 | 0.05% | 0.23% | 8.79 |
| $50-100 billion | 17 | 63.7 | 3.5% | 7.6% | -11% | 28.4% | 1 | 0.54% | 1.03% | 0.66 |
| $10-50 billion | 89 | 101.0 | 5.6% | 6.4% | +19% | 8.6% | 11 | 0.06% | -0.07% | 0.28 |
| $1-10 billion | 268 | 26.7 | 1.5% | 1.5% | +4% | 7.0% | 11 | 0.40% | -0.02% | 0.15 |
| Under $1 billion | 221 | 1.9 | 0.1% | 0.3% | +7% | 5.8% | 5 | 0.04% | 0.13% | 0.01 |
Who the Borrowers Are
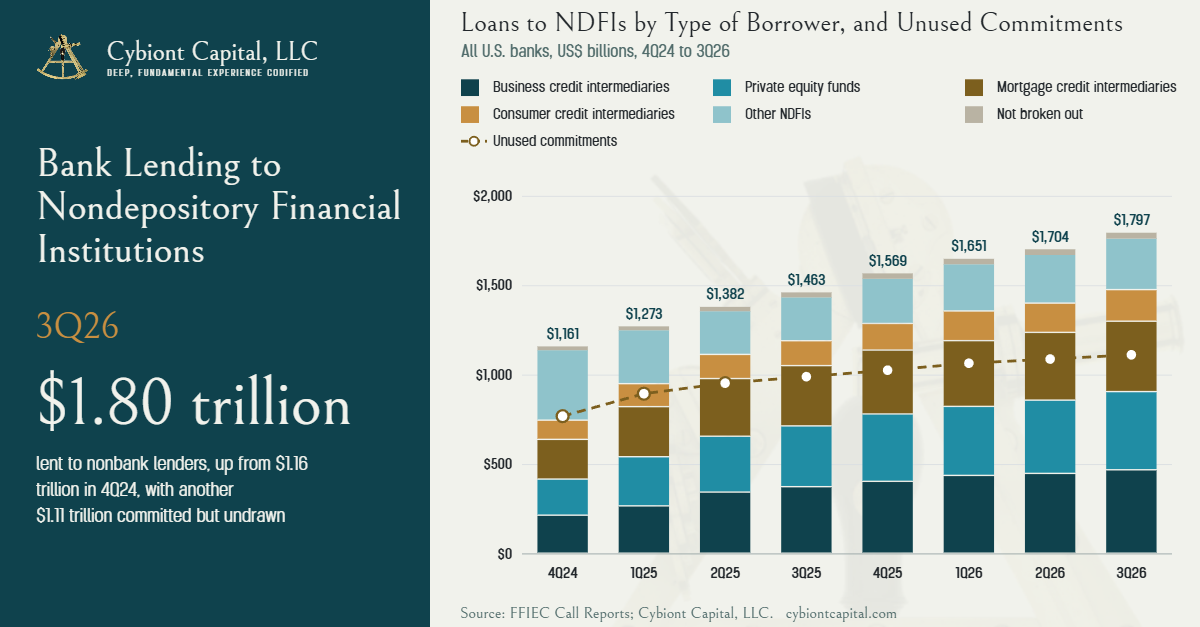
Of the $1,797 billion, the borrower-type detail covers $1,764 billion (Chart 3). Business credit intermediaries, the category that holds business development companies, private credit funds and commercial finance companies, are the largest at $467 billion, up from $213 billion in 4Q24. Loans to private equity funds, mostly subscription and capital-call lines secured by investors' commitments, are $437 billion, up from $202 billion. Mortgage credit intermediaries (warehouse and servicer lines) are $394 billion, up 77%, and consumer credit intermediaries $177 billion, up 64%. "Other" fell from $395 billion to $289 billion as banks sorted loans into the named types during 2025, so part of the growth in the named types is classification too.
Unused commitments to NDFIs are $1,114 billion, up from $770 billion in 4Q24, and banks have drawn 62% of their total NDFI lines. Counting the undrawn lines, bank exposure to NDFIs is about $2.9 trillion. These lines are drawn hardest when nonbanks lose their other funding, which is when banks would least want to fund them.
Chart 3: Loans to NDFIs by Type of Borrower, and Unused Commitments, All Banks, 4Q24 to 3Q26 ($ billions)
Credit Quality: Clean, With the First Movement
NDFI loans remain the cleanest commercial book banks hold. 0.073% were 90+ days past due or on nonaccrual in 3Q26, against 0.93% of all loans (Chart 4). The 30–89 day past-due rate, the earliest signal we have, rose to 0.060% from 0.041% a year earlier.
Formation tells the same story. NDFI loans became problem loans at an annualized 0.24% of performing loans in 3Q26 ($1.03 billion in the quarter), up from 0.14% in 2Q26, the first increase since 3Q25; problem NDFI loans rose $0.33 billion in the quarter. Against other loan types the level is low: 1.46% for C&I loans, 1.05% for ComRe and 1.29% for all loans (Chart 5). The one size group that stands out is banks of $50–100 billion: formation of 1.03% and a noncurrent rate of 0.54%, on a book that shrank 11% over the year.
Low reported delinquency is what this kind of lending looks like until it does not. Losses on loans to lenders come from fraud, collateral that is not what the borrowing base says, or the collapse of the nonbank's own funding, and they tend to arrive as single large chargeoffs rather than as a slow rise in past-due loans. The past-due history here is short and covers a benign period.
Chart 4: Past-Due and Noncurrent Rates, NDFI Loans, 4Q24 to 3Q26
Chart 5: Underperforming Loan Formation Rate by Loan Type, All Banks, 3Q26
What Banks Reserve, and What They Should
Banks do not report an allowance for NDFI loans. Banks of $1 billion and over report their allowance by six loan types (Schedule RI-C, Part II), and NDFI loans fall inside "commercial" with C&I loans, leases and other loans. They are a large part of it: $1,784 billion of the $5.45 trillion of commercial loans those 544 banks report, or 33%. Against that book banks hold $51.0 billion, 0.94%.
The allowance rate on commercial loans falls steadily as the NDFI share rises (Chart 6): 1.52% at banks with no NDFI loans, 1.14% where NDFI loans are 10–25% of commercial loans, 0.87% at 25–50% and 0.64% where they are more than half. Fitting each bank's commercial allowance to its NDFI and other commercial loans gives an NDFI reserve rate of about 0.39% (90% range 0.05% to 0.73%) against 1.21% for other commercial loans, or roughly $6.9 billion of allowance on NDFI loans. The estimate is indicative: the banks with the most NDFI lending are also custody and wealth-management banks whose other commercial loans are low-risk too.
Our ACL model reaches a similar order of magnitude by a different route. It treats NDFI loans as their own category and requires $9.88 billion: $8.93 billion on performing loans and expected draws on commitments, and $0.95 billion on problem loans (Chart 7). That is 0.55% of NDFI loans. The lifetime reserve rate on NDFI exposure has fallen from 0.38% in 4Q24 to 0.35% as the book grew faster than its problem loans, and the industry annual loss rate the model applies is 0.13%. Because there is no NDFI chargeoff line, the model takes that rate from banks whose "all other loans" are mostly NDFI loans, and assumes a 75% loss given default, the same as C&I. Both the banks' reserves and ours rest on a short, benign history; a single fraud or a funding run at a large nonbank borrower would test them.
Chart 6: Reported Allowance on Commercial Loans by NDFI Share of Commercial Loans, Banks of $1 Billion and Over, 3Q26
Chart 7: Cybiont ACL Model: NDFI Reserve Requirement and Lifetime Reserve Rate, 1Q10 to 3Q26
Data and Universe
- Banks. All 4,267 Call Report filers in 3Q26, 627 of them with NDFI loans, measured bank by bank (not rolled up to holding companies). The subscriber tables add holding companies from the FR Y-9C, which also captures NDFI loans held outside bank subsidiaries.
- Period. NDFI loans from 1Q10, when the Call Report line begins; borrower types, commitments and past-due detail from 4Q24; formation from 1Q25, the first quarter with an opening stock of reported NDFI problem loans. 3Q26 figures are from the first release of the quarter's Call Reports and may be revised.
- Reporting breaks. In 4Q24 banks with foreign offices moved from domestic to consolidated reporting (+$115.5 billion) and new instructions moved about $209 billion into the line from C&I and other loans over 4Q24–2Q25. We have not restated the history for either.
- Chargeoffs. There is no NDFI chargeoff line. NDFI chargeoffs in formation and in the model are "all other loans" chargeoffs shared by balance.
- Reserves. Reported allowances by loan type are Schedule RI-C, Part II, filed quarterly by banks of $1 billion and over. The model figures are from Cybiont ACL Model v.1.
Conclusion
Loans to nonbank lenders are now an eighth of bank lending and are growing more than three times as fast as the rest, even after the 2024 reporting changes are set aside. On every measure the Call Report offers, the book is performing: noncurrent loans are less than a tenth of the industry rate and formation a fifth. The questions are what the measures cannot yet show. The credit history is seven quarters long, there is no chargeoff line, banks appear to reserve the loans at about a third of the rate of their other commercial loans, and over a trillion dollars of undrawn lines would be drawn in exactly the conditions that produce losses. We will track formation and the 30–89 day rate each quarter, and the subscriber tables below show where the exposure sits.
The full tables — the 25 largest holding-company lenders by borrower type, the banks lending more to NDFIs than their capital & reserves, and how the largest lenders' reserves compare with our model — are available to subscribers at the end of this article. Subscribing is free.
- Two limits apply throughout. The Call Report has no chargeoff line for NDFI loans, so NDFI chargeoffs are an allocation of "all other loans" chargeoffs by balance. And past-due and nonaccrual detail starts only in 4Q24, so the credit history of the category as reported is seven quarters long. ↩︎

Subscribe to continue reading
Subscribe to get access to the rest of this post and other subscriber-only content.
