
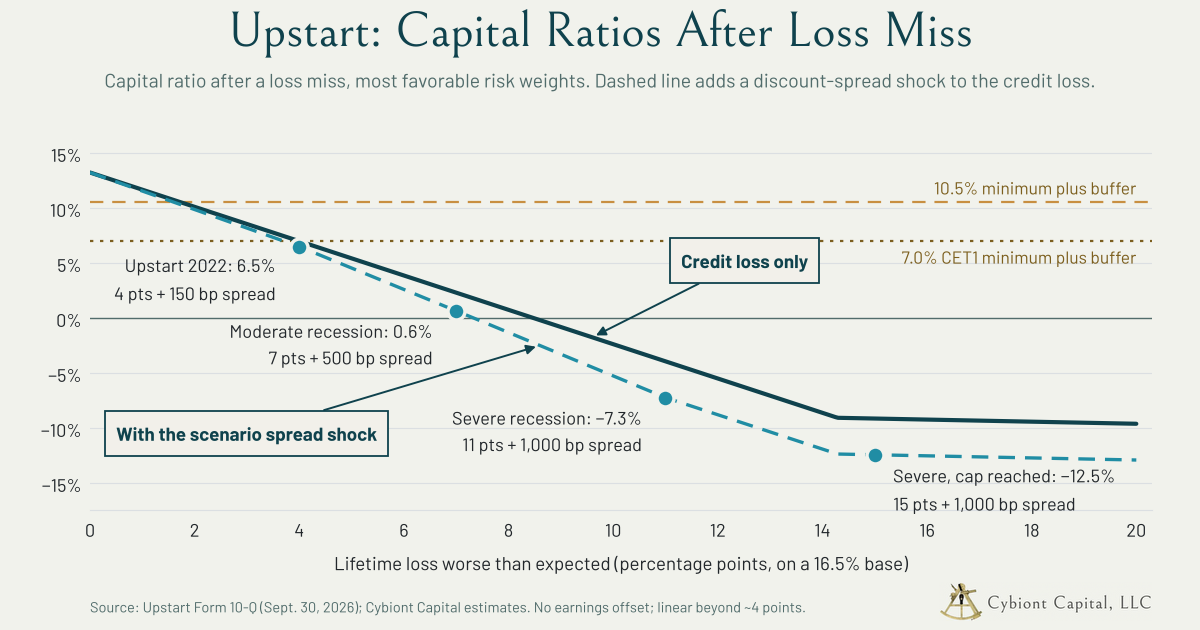
Even on the risk weights most generous to Upstart, a modest miss on loss rates uses up its cushion
Summary
In previous analysis, we made a strong case for very high risk-weights for proposed Upstart HoldCo securitization assets. In this analysis, we give Upstart the most favorable risk weights available, and demonstrate that its 13.2% proforma capital ratio still rests on a thin cushion. Each point of lifetime loss above expectations costs about $90 million. About 1.7 points takes proforma Upstart Holdco below 10.5%; about 4 points, the size of the miss it already took in 2022 with unemployment near record lows, takes it to 7%. A mild recession, with the spread widening that comes with it, leaves capital near zero; a severe one puts it well below. If regulators accept low risk weights, they need to require much more capital, at the holding company and probably the bank too.
Background & Occasion for Analysis
The Office of the Comptroller of the Currency (OCC) has conditionally approved a national bank charter for Upstart Bank, N.A. The approval requires a 12% Tier 1 leverage ratio and a 15% total risk-based capital ratio for three years. We acknowledge that Upstart’s management has planned very limited operations for the bank. That fact makes the OCC’s conditional approval the easy part. The Federal Deposit Insurance Corporation (FDIC) still has to act on deposit insurance, and the Federal Reserve on the holding company. Neither has disclosed what capital levels or capital plans it will require of the holding company by the Fed or additional requirements at the bank to grant deposit insurance. The question for both is how much capital Upstart Holdings (NASDAQ: UPST) needs, given who it lends to and how its risk is structured.
1. Start with the benefit of the doubt
This analysis gives Upstart the most favorable risk weights available: the Simplified Supervisory Formula Approach (SSFA) for its beneficial interests and 100% for its consumer loans (NOTE: we don’t believe the SSFA is fit for UPST’s underlying collateral like; but for sake of argument here, we are assuming it is. See Reevaluating Upstart’s Capital After the “First-Loss” Pushback). On that basis Upstart as a proposed consolidated holding company that owns 100% of Upstart Bank, N.A. has about $766 million of Common Equity Tier 1 (CET1) capital1 against about $5.8 billion of risk-weighted assets, a 13.2% ratio (Appendix A). Not only do we think that 13.2% is too low today, it’s highly susceptible to very reasonable shocks to loss rates on the underlying collateral behind UPST’s securitizations assets.
2. Upstart’s own numbers
Upstart discloses that a 20% increase in expected losses on the loans behind its beneficial interests would cost it $280 million. On pools expecting about 16.5% lifetime cumulative net loss (CNL)2, that’s about 3.3 percentage points. Add the loans on its own balance sheet, and every point of lifetime loss above expectations costs Upstart about $90 million (Appendix B).
| Lifetime loss worse than expected | Capital ratio after | New equity to hold 10.5% | New equity to hold 15% |
|---|---|---|---|
| None | 13.2% | $0 | $107M |
| 2 points | 10.1% | $25M | $294M |
| 3 points | 8.5% | $117M | $387M |
| 4 points | 7.0% | $209M | $480M |
| 5 points | 5.4% | $302M | $574M |
About 1.7 points puts Upstart below a 10.5% total capital ratio, the Regulation Q minimum plus the capital conservation buffer. About 4 points takes CET1 to 7.0%, the CET1 minimum plus the buffer. If discount-rate spreads also widen by 150 basis points (bp), those thresholds fall to about 1.4 and 3.7 points (Appendix C).
3. A few points is not a tail event
Upstart has already been through a miss this size (Appendix F; on why credit card evidence is used only as background, Appendix G):
- 2022: With unemployment near record lows, Upstart told investors its losses would run about 25% above expectations. That’s roughly 4 points on a 16.5% base.
- 2022–24: Upstart’s own macro index, which measures how far the economy is pushing defaults above its long-run baseline, peaked 68% above baseline in January 2024. That’s roughly 11 points, though it reflects economic pressure on defaults rather than realized losses.
- 2001: In a mild recession, charge-offs at a large subprime card issuer rose about 40%. That’s roughly 7 points.
- 2008–09: Charge-offs on HSBC Finance’s unsecured personal loans nearly doubled. That’s roughly 15 points, an upper bound because peak annual charge-off rates overstate lifetime losses.
The reason is the borrower. Upstart lends mostly to near-prime and subprime consumers, many of them consolidating credit card debt, on fixed-rate loans that can’t be repriced once made.3 Its beneficial interests absorb the difference between actual and initially expected losses on about $10 billion of investor-held loans.4 A small change in the loss rate across a large pool lands on a much smaller equity base.
4. If the economy turns
Upstart’s 2022 miss came with unemployment near record lows. A recession would be worse, and history gives two benchmarks:
- A mild recession, like 2001. Losses at subprime lenders ran about 40% above prior levels, roughly 7 points on Upstart’s base. On the same favorable risk weights, that takes Upstart’s capital ratio to about 2%. Add the 500 bp spread widening we assume for a moderate recession and it falls to about 0.6%, or about 3% even if Upstart kept earning at today’s pace for a year, which it likely wouldn’t. Holding 10.5% would take about $580 million of new equity; holding 15% would take about $860 million.
- A severe recession, like 2008–09. Charge-offs on unsecured personal loans roughly doubled, roughly 11 to 15 points on Upstart’s base. A miss of 11 points would leave Upstart’s CET1 about $230 million below zero, a ratio of about −4%; with a 1,000 bp spread widening, about $420 million below zero (about −7%). At about 15 points, Upstart’s losses on its beneficial interests reach the roughly $1.2 billion contractual cap, which leaves CET1 about $530 million below zero (about −9%), or about $720 million below zero (about −12%) with the spread widening. These figures go beyond Upstart’s disclosed assumptions and extrapolate them in a straight line; nothing in Upstart’s structure suggests losses would grow more slowly than that before the cap (Appendix D).
| Scenario | Loss, credit + spread ($M) | Ratio, credit loss only | Ratio with spread | Ratio with spread + a year of earnings (upper bound) | Equity for 10.5% | Equity for 15% |
|---|---|---|---|---|---|---|
| Upstart 2022 (no recession) 4 points · 150 bp | 391 | 7.0% | 6.5% | 9.1% | $239M | $510M |
| Moderate recession (2001-scale) 7 points · 500 bp | 729 | 2.3% | 0.6% | 3.2% | $584M | $859M |
| Severe recession (2008–09-scale) 11 points · 1,000 bp | 1,186 | −4.0% | −7.3% | −4.7% | $1,051M | $1,330M |
| Severe, contractual cap reached 15 points · 1,000 bp | 1,487 | −9.2% | −12.5% | −9.9% | $1,359M | $1,641M |
Three features of Upstart’s model would make a recession harder than the arithmetic suggests:
- Spreads widen. Buyers demand higher returns when losses rise, and most of all from the bottom of the capital structure, where Upstart’s exposure sits. Upstart’s loan discount spreads widened about 150 bp from 2021 to 2024 without a recession; in 2008, BBB credit card bonds reached about 2,500 bp over swaps. Each 100 bp costs Upstart about $19 million, so a 500–1,000 bp widening would add roughly one to two points of loss (Appendix E and Appendix I).
- Earnings shrink when they are needed most. Upstart’s fees depend on investors continuing to buy its loans. When that funding pulled back, Upstart lost $108.7 million in 2022 and $240.1 million in 2023 (Appendix H).
- Repricing protects new loans, not old ones. Upstart adjusts its underwriting monthly, but the loans already outstanding, roughly two years of originations given a 1.8-year average life, absorb the miss.
5. What this implies for capital requirements
If the agencies accept the favorable risk weights, the capital level has to absorb the shock instead. Holding 10.5% after a 4-point miss would take about $209 million of new equity; holding the OCC’s 15% if carried through to the HoldCo would take about $480 million. Put the other way: a regulator that wants Upstart to stay well capitalized through a loss miss that it has already experienced needs effective risk weights well above what the SSFA produces, or a holding-company capital condition that does the same job.
How the Fed may look at the holding company. The Federal Reserve, which supervises the holding company, judges capital by whether a firm stays above its minimums through a severe recession, and its risk weights are built to absorb a roughly 1-in-1,000-year loss. Applied to Upstart’s book, the Fed’s stress-test standard implies about 8 to 12 points of additional lifetime loss, enough to consume essentially all of the holding company’s current $766 million of CET1. Staying above the 4.5% CET1 minimum through that shock would take roughly $1.0 billion to $1.35 billion of CET1 before any credit for earnings. At the 1-in-1,000 standard, losses on the beneficial interests reach Upstart’s contractual cap, which means those positions warrant capital equal to Upstart’s full exposure, as a 1,250% risk weight would require. Upstart is far too small for the Fed’s formal stress tests, but the Fed can require a holding company to hold more than the minimums when its risks warrant it, and it can attach capital commitments to its approval. (See the supporting note on tail-risk standards and the calculation.)
6. Run your own numbers
These estimates are largely mechanical: Upstart’s disclosed sensitivities multiplied by an assumed shock. The judgment is in the inputs, mainly:
- the base loss rate on the investor-held pools
- the risk-weight treatment
- the size of any spread widening
- how much future earnings to count
That’s why we built an interactive calculator, at the end of this post, that lets you set those inputs yourself. The appendix explains each step, and Appendix J lists the limitations.
7. A path to losing brokered deposits, even if the bulk of the risk stays at the holding company
Upstart Bank plans to fund itself largely with brokered deposits. Access to them depends on the bank’s own capital category, not the holding company’s, so it might seem that keeping the riskiest assets at the holding company protects the bank’s funding. It does not. A plausible path:
- Losses hit the holding company. A loss miss of the size in Table 2 lands on the beneficial interests the holding company keeps. The bank’s own ratios are untouched.
- Supervisors respond. The Federal Reserve expects a holding company to serve as a source of strength to its bank. A parent that can no longer do so invites a written agreement or order, and the OCC can require the bank itself to maintain a specific capital level.
- The bank loses “well capitalized” status, whatever its ratios. A bank subject to a written agreement, order or directive to meet and maintain a specific capital level cannot be well capitalized, even at a 15% ratio. Supervisors can also treat a bank as one category lower, or designate it in “troubled condition,” if they find it in unsafe or unsound condition.
- Brokered deposits become restricted. A bank that is not well capitalized needs an FDIC waiver to accept, renew or roll over brokered deposits, and the rates it can pay are capped. For a bank funded mainly with brokered deposits, that is a liquidity problem, not an inconvenience. Medallion Bank, an industrial bank funded largely with brokered deposits, warns its investors of exactly this risk.5
- Private counterparties may move first. Deposit brokers and sweep networks apply their own limits and can pull back on holding-company headlines before any regulator acts.
The separation also runs one way. The holding company is supposed to support the bank, but affiliate-transaction rules limit how much the bank can support the holding company. And in practice the risk will not all stay at the parent: Upstart plans for the bank to use the brokered deposits it raises to buy most of the existing loan book, so losses on those loans would hit the bank’s capital directly. The bank’s funding depends on the consolidated company’s capital, which is why the capital test belongs at the consolidated level.
8. The business model breaks first
Before losses got anywhere near the severe cases, the market for Upstart’s loans would likely close, as it did in 2022. That year, with no recession at all, Upstart’s funding tightened and its conversion rate fell from 24% to 13%. Upstart’s response was to take on the risk itself: it held more loans on its balance sheet and agreed to absorb losses above initial expectations to bring investors back. Those arrangements are the exposure measured here.
A funding breakdown limits new lending, but it does not shrink the losses already on the books or on the roughly $10 billion of investor loans Upstart has committed to support. It does remove the fee income that would otherwise absorb those losses. And with a bank charter, the bank becomes the natural buyer of last resort when investors will not pay a profitable price, putting insured deposits behind loans no one else wants at the worst point in the cycle. That is why Upstart’s capital should be calibrated to the shock rather than to normal conditions, and why the agencies should hold the holding company to at least the same discipline as the OCC’s condition requiring notice before Upstart changes its business plan.
Disclosure: Robert Lacoursière, Allen Puwalski, or both hold a personal position in UPST. This report is for informational purposes only and is not investment advice or a recommendation to buy or sell any security.
Notes
1 We measure capital as CET1 throughout because essentially all of Upstart’s existing capital is common equity. It has no preferred stock or subordinated debt, and its convertible senior notes are senior debt that does not qualify as regulatory capital, so its CET1, Tier 1 and total capital are effectively the same amount. The OCC’s conditions for Upstart Bank are stated as a 12% Tier 1 leverage ratio and a 15% total risk-based capital ratio, not a CET1 ratio, so in principle the 15% total requirement could be met partly with Tier 2 instruments such as qualifying subordinated debt. We think that is unlikely to be allowed in practice. The leverage condition already requires Tier 1 capital, regulators generally expect a de novo bank’s capital to be common equity, and Tier 2 instruments absorb losses only once a firm has failed, which is little help for a business whose risk is that its equity is consumed by fair-value losses while it is still operating. The Basel Committee’s own explanation of its 99.9% standard notes that Tier 2 lacks the loss-absorbing capacity of Tier 1. ↩
2 The 16.5% lifetime CNL is our estimate. Upstart does not disclose the expected loss rate on the investor-held loans that its beneficial interests reference. We approximate it with the closest figures Upstart does report: the weighted-average “credit risk rate,” which Upstart defines as the share of original principal it expects will not be repaid over a loan’s life, was 16.25% for loans in its personal-loan securitizations and 16.54% for loans it held at fair value at June 30, 2026 (Form 10-Q/A). We use the midpoint, rounded. The estimate matters because it converts Upstart’s disclosed sensitivity to a 20% relative increase in losses into points of loss: a lower base would make each point more costly (at 12%, about $117 million per point on the beneficial interests alone), so 16.5% is the more favorable assumption for Upstart. Appendix B shows the calculation. ↩
3 Upstart reports that in December 2025 the majority of rate checks on its platform listed debt consolidation or credit card refinancing as the use of funds, and that more than 2.7 million borrowers had selected that purpose as of December 31, 2025 (Upstart, Debt Consolidation Loans); these are rate checks and borrower-reported purposes, not funded loans. Upstart markets its personal loans as fixed-rate, fixed-payment installment loans. “Near-prime and subprime” is our characterization, not Upstart’s: rating agency presale reports put the weighted-average FICO score of Upstart’s securitized pools in the low-to-mid 600s (654 for UPST 2022-1 and 652 for UPST 2022-2), which is the near-prime band, and at least one 2022 pool reportedly had about 30% of borrowers at 619 or below. The credit mix of current pools and of the loans behind the beneficial interests may differ. ↩
4 The mechanism is Upstart’s own description; the size is our estimate. In its Form 10-Q filings, Upstart describes its committed-capital and co-investment arrangements with investors as beneficial interests under which it pays or receives amounts based on how the referenced loans perform relative to initial expectations, subject to a dollar cap. Upstart reported about $9.2 billion of principal of investor-held loans referenced by these arrangements at June 30, 2026 (Form 10-Q/A); we scale that to about $10.4 billion at September 30, 2026 in proportion to the growth in beneficial interest assets over the quarter, because the September figure had not been extracted. Upstart does not absorb all of the difference. Its disclosed sensitivity (a $280.3 million loss for a 20% relative increase in expected losses, against roughly $343 million of added losses on the referenced pools) implies it bears about 82%, and its total exposure is capped at about $1.2 billion of beneficial interest assets and pledged cash. Upstart does not disclose where these positions rank relative to investors’ losses (Appendix A, Appendix B). ↩
5 Medallion Financial Corp., Form 10-K for 2020. Medallion Bank, a Utah industrial bank, says it uses brokered deposits to fund a substantial portion of its activities. It explains that federal law bars an insured bank from accepting brokered deposits unless it is well capitalized, or adequately capitalized with an FDIC waiver, and that a bank subject to a written agreement, order or directive to meet and maintain a specific capital level is not well capitalized. It warns that losing the ability to accept, renew or roll over brokered deposits, whether by failing capital standards or by becoming subject to such an agreement, order or directive, would have a material adverse effect on its business, financial condition, liquidity and results of operations. Medallion Bank also operates under a 2003 capital maintenance agreement to remain well capitalized (10-K). ↩
6 About 15 points is an upper bound. It applies the rise in HSBC Finance’s annualized charge-off rate on unsecured personal loans, from 11.2% in early 2008 to 21.5% in the third quarter of 2009 (about 1.9 times), to Upstart’s 16.5% lifetime loss base. Peak annual rates overstate lifetime losses because peaks are temporary and Upstart’s loans have an average life of about 1.8 years. ↩
Appendix
A. Capital base and risk weights
| Item (September 30, 2026) | $M |
|---|---|
| Total stockholders’ equity | 887.4 |
| Less goodwill | (67.1) |
| Less loan servicing assets (estimate, June 30 balance) | (54.8) |
| CET1 capital | 765.5 |
| Risk-weighted assets, SSFA basis | 5,797 |
| CET1 and total capital ratio | 13.2% |
Upstart has said its beneficial interests would carry risk weights above 100% but below 1,250%, which is consistent with the SSFA. The SSFA result depends on where the positions are assumed to attach in the referenced pool; this analysis uses 10%.
The SSFA’s measure of the underlying pool’s risk doesn’t rise with expected loss. For pools expecting 15–20% lifetime losses, it therefore produces lower capital than approaches that account for expected loss. Those alternatives produce substantially higher requirements:
- a supervisory-formula approach that includes expected loss
- a lifetime stress approach
- an approach modeled on current expected credit loss (CECL) accounting
Using the SSFA throughout is the concession to Upstart.
B. Converting Upstart’s disclosure into dollars per point
Upstart discloses the fair-value effect of 10% and 20% relative increases in expected credit losses. A relative shock becomes percentage points when multiplied by the base lifetime CNL. Loss per point = disclosed loss ÷ (20% × base CNL) × 1%.
| Exposure | Disclosed loss, 20% shock | Loss per point |
|---|---|---|
| Beneficial interests ($226.9M asset decline + $53.4M liability increase) | $280.3M | $84.9M |
| Loans at fair value ($940.7M; scaled from June 30) | $18.2M | $5.5M |
| Total | $90.5M |
Upstart doesn’t disclose the base CNL on the investor-held pools; 16.5% approximates the credit risk rate on its personal-loan securitizations. A lower base raises the cost per point. At 12%, the beneficial interests alone would cost about $117 million per point, so the 16.5% assumption favors Upstart.
C. Results with and without a discount-spread shock
| Lifetime CNL worse by | Ratio, no spread shock | Ratio, +150 bp | Equity for 10.5%, +150 bp | Equity for 15%, +150 bp |
|---|---|---|---|---|
| 0 points | 13.2% | 12.7% | $0 | $137M |
| 1 point | 11.6% | 11.1% | $0 | $230M |
| 2 points | 10.1% | 9.6% | $54M | $323M |
| 3 points | 8.5% | 8.0% | $146M | $417M |
| 4 points | 7.0% | 6.5% | $239M | $510M |
| 5 points | 5.4% | 4.9% | $331M | $603M |
The spread loss uses Upstart’s disclosed sensitivities: about $6.6M per 100 bp on beneficial interests and about $12.5M on loans. New equity is grossed up for the 20% risk weight on the cash it creates.
D. Is the loss linear?
Upstart’s disclosed loss for a 20% shock is 1.98 times its loss for a 10% shock. The relationship is close to linear across the range Upstart tests, roughly 1.7 to 3.3 points, so results up to about 4 points are a short extrapolation. Beyond that the linear figure is less reliable. Losses on the beneficial interests are capped by Upstart’s total exposure under the arrangements, about $1.2 billion including pledged cash.
E. Discount rates and spreads
Higher losses normally come with buyers demanding higher returns. Measured against the 2-year Treasury:
- Upstart’s loan discount rate rose 458 bp during 2022, but 368 bp of that was the Treasury move.
- The loan spread widened about 90 bp in 2022, and about 150 bp from late 2021 to its 2024 peak.
- Residual certificate spreads widened about 230 bp in 2022 and about 340 bp to their peak.
Set against Upstart’s roughly 4-point loss miss in 2022, that implies about 20–40 bp of spread per point of lifetime loss.
Upstart’s valuation method doesn’t link the two:
- Discount rates on its beneficial interests have stayed within a fixed range of 7–14%.
- The rate on the liabilities held at 14.00% even as Upstart’s estimate of how far losses exceed original expectations rose.
- In Q3 2026 the 2-year Treasury rose about 75 bp while the discount rate on the beneficial interests didn’t move. That compressed its spread about 190 bp below its 2023–25 average.
In dollars the spread effect is modest next to the credit effect, but a buyer in a stress wouldn’t hold rates flat. Appendix I looks at how far spreads have widened in past shocks.
F. Historical evidence on loss misses
| Episode | Measure | Gap | Points on a 16.5% base |
|---|---|---|---|
| 2001–02, card industry | Net credit losses, 5.91% → 6.55% | +11% | ~1.8 |
| 2001–02, Metris (subprime card) | Managed charge-offs, 10.9% → 15.5% | +42% | ~7 |
| 2022, Upstart (no recession) | Losses vs. expectations | ~+25% | ~4 |
| 2022–24, Upstart Macro Index | Macro-driven defaults vs. baseline | up to +68% | ~11 |
| 2008–09, HSBC Finance personal loans | Charge-offs, 11.2% → 21.5% | ~1.9x | ~156 |
Caveats on the table:
- Peak annualized charge-off rates overstate lifetime loss misses, because peaks are temporary and Upstart’s loans have a weighted-average life of about 1.8 years.
- The Upstart Macro Index measures macroeconomic pressure on defaults, not realized losses against original expectations. Upstart recalibrates its underwriting to it, so the loans already on the books bear the gap.
Other evidence points the same way:
- Rating agencies require subprime auto securitizations to withstand 2.0 to 3.5 times expected losses for a AAA rating.
- Federal Reserve research finds loss models underpredict in downturns even with perfect foresight, and by much more with the forecasts actually available at the time.
G. Are credit cards comparable?
Not fully, and the comparison cuts both ways.
Personal loans have advantages:
- no undrawn line to draw down in distress
- quick amortization
They also have disadvantages:
- Card lenders can cut lines and reprice future balances; a fixed-rate personal loan can’t be changed once made.
- Many personal-loan borrowers are consolidating card debt and may run those balances back up.
- Card loss rates are diluted by borrowers who pay in full every month.
Card losses also start from a lower base, and higher-loss pools show smaller relative swings. Card charge-offs roughly tripled in 2008–09 while HSBC’s personal loans roughly doubled. This analysis therefore relies on unsecured installment-loan evidence and uses cards only as background: HSBC, LendingClub’s 2016 underperformance, and Upstart’s own 2022 experience.
H. Earnings offset
Stress tests count pre-tax earnings against losses. At the Q3 2026 pace of $37.2 million a quarter, a year of pre-tax income (about $150 million) absorbs about 1.7 points. That moves the thresholds to roughly 3.4 points for 10.5% and 5.6 points for 7.0% CET1. The offset is least reliable in exactly the scenario that matters. Upstart’s fee revenue depends on investors continuing to fund loans, and it reported net losses of $108.7 million in 2022 and $240.1 million in 2023. Treat the earnings-adjusted figures in this post as an upper bound. The calculator lets you include or exclude the offset.
I. How far spreads widen in a shock
Upstart’s exposure is not senior paper. KBRA rated the notes in Upstart’s 2020-1 securitization from A- down to BB-, and even the senior notes in Upstart deals don’t reach AAA. Upstart’s own positions sit lower still:
- Beneficial interests are residual, risk-retention and co-investment positions beneath the lowest rated note. They take first loss, are unrated and trade like equity.
- Loans held on the balance sheet are unsecured whole loans with no credit enhancement. Rated as a single class they would land around B or below, because they absorb the full loss distribution.
The relevant history is therefore the bottom of the capital structure, which moves by multiples of the senior classes:
| Episode | Exposure | Widening |
|---|---|---|
| 2002, subprime card stress | Capital One subordinated card ABS, gap over its own unsecured debt | Gap peaked at 1,085 bp |
| 2008, financial crisis | AAA 2-year credit card ABS | Over 500 bp (Dec. 2008) |
| 2008, financial crisis | BBB 2-year credit card ABS | About 2,500 bp (Dec. 2008) |
| 2008, financial crisis | Single-A and BBB 5-year card ABS, one month | +325 to +500 bp (Sept. 2008) |
| 2020, liquidity shock | AAA 5-year credit card ABS | 28 → 336 bp |
| 2020, liquidity shock | Generic BBB consumer ABS (Europe) | +200 bp, to low 400s |
| 2020, liquidity shock | BB CLO tranches | +215 bp, to about 900 bp |
| 2022, Upstart (no recession) | Upstart loan discount spread over 2-year Treasury | +90 bp in year; +150 bp to 2024 peak |
| 2022, Upstart (no recession) | Upstart residual discount spread | +233 bp in year; +340 bp to peak |
| March 2023, bank failures | Subprime auto ABS | +50 to +100 bp in one week |
Three points follow.
- The bottom of the structure moves most. In 2008, BBB card spreads peaked about five times as wide as AAA. After the 2020 shock, BB- and B rated subprime auto classes were still at or wider than their pre-shock spreads in early 2021, while senior classes had fully recovered.
- Forced sellers get the worst prices. The natural buyers of a specialized asset are usually under the same strain as the seller, so assets sold under pressure go to less informed buyers at lower prices (Shleifer and Vishny). Upstart has to keep selling new loans to fund the business. LendingClub faced this in 2016: it paid investors $14.0 million and $10.7 million in incentives in the second and third quarters and attributed its fair-value declines mainly to the higher yields investors required.
- Liquidity can move spreads before credit does. In 2020 and in the 2023 bank failures, spreads widened sharply with little change in losses. A credit shock and a liquidity shock together compound.
What we assume. For Upstart’s loans and beneficial interests, we treat a 500 bp widening as a moderate recession case and 1,000 bp as a severe one. At about $19.1 million per 100 bp (Appendix E), that is roughly $96 million and $191 million, or about one and two additional points of lifetime loss at $90.5 million per point (Appendix B). The 150 bp case in Appendix C reflects Upstart’s 2022 experience, a mild episode.
Caveats. Much of a liquidity widening reverses, as it did in 2009 and after the Fed’s 2020 intervention. Upstart’s beneficial interests are short-duration, which the $19.1 million sensitivity already reflects. And Upstart’s Level 3 marks may lag the market: its beneficial-interest discount rates have stayed within a fixed band. That delays when the loss shows up in reported capital; in the meantime it shows up as lost volume and margin (Section 8).
J. Limitations
- Risk-weighted assets are held constant after the shock; falling fair values would reduce them slightly.
- Upstart doesn’t disclose the base CNL on the investor-held pools, the SSFA attachment point, or its September 30 servicing assets; these are estimates.
- Beneficial-interest liabilities aren’t shocked for discount rates, because Upstart reports no material rate sensitivity for them.
- Discount-rate series are fair-value-weighted averages and shift with product mix.
- This is an analytical estimate, not a regulatory capital calculation, and not investment advice.
Sources
- Upstart Form 10-Q, September 30, 2026
- Upstart Form 10-Q/A, June 30, 2026
- OCC Corporate Decision #1382, Upstart Bank, N.A.
- Upstart, UMI reporting update, July 8, 2026
- 7investing, Upstart Q3 2022
- Morningstar DBRS, Upstart Securitization Trust rating actions
- Metris Companies Form 10-K, 2002
- HSBC Finance Form 10-Q, September 30, 2009
- American Banker, 2002 card profitability study
- S&P Global Ratings, Auto ABS methodology
- Philadelphia Fed Working Paper 20-09
- LendingClub investor letter, October 14, 2016
- Upstart, Second Quarter 2022 Results (August 8, 2022)
- Medallion Financial Corp. Form 10-K, 2020 (brokered deposits risk)
- Federal Reserve Board, Report to the Congress on Risk Retention (2010), figure data
- KBRA, Upstart Securitization Trust 2020-1 preliminary ratings
- KBRA, Upstart Securitization Trust 2026-1 preliminary ratings
- S&P Global Ratings, U.S. Credit Card Quality Index, Q2 2020
- S&P Global Ratings, auto ABS new issue spreads, March 2021
- TwentyFour/Vontobel, “ABS spreads are pricing in a lot of downside” (2020)
- Asset Securitization Report, “Citigroup minds the gap once again” (2002)
- Asset Securitization Report, “Credit Cards Top Dismal Third Quarter” (2008)
- Auto Finance News, auto ABS spreads after the March 2023 bank failures
- Shleifer and Vishny, “Fire Sales in Finance and Macroeconomics,” NBER WP 16642
- LendingClub Form 10-Q, June 30, 2016
Appendix: interactive loss-shock calculator (for subscribers)
The calculator lets you set the loss shock, the base loss rate on the investor-held loans, a discount-spread shock, how much future earnings to count, and the target capital ratios, and shows Upstart’s capital ratio and the new equity it would need. Every other assumption can be changed under “All inputs.” Subscribe free to unlock it.

Subscribe to continue reading
Subscribe to get access to the rest of this post and other subscriber-only content.
