Each quarter we consider trends in loan quality at publicly traded commercial banks. With all eyes on Commercial Real Estate (ComRe), we present the stock and flow of underperforming ComRe loans1 from over 700 commercial banks by asset class.
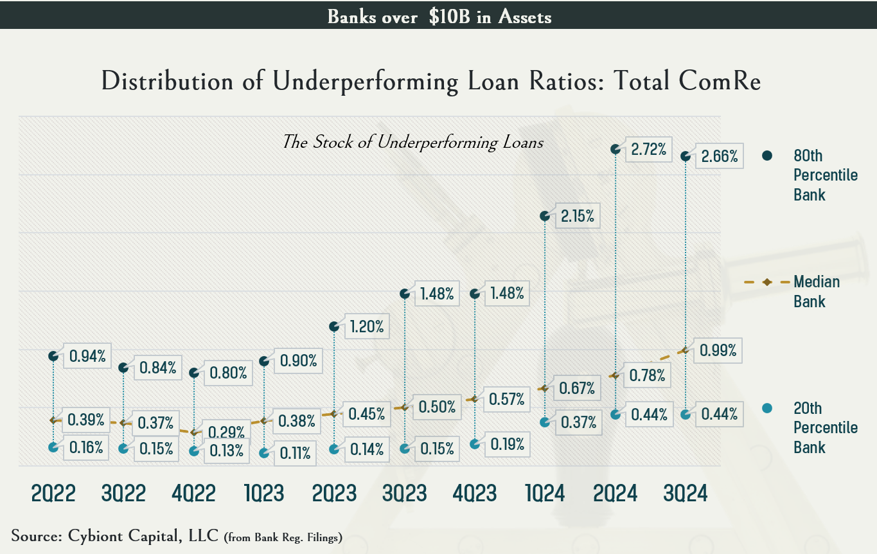
Levels and trends in underperforming loans continues to be most concerning at banks over $10 billion (120 companies in our universe) (See feature graph and Graph 1). Lower mid-curve rates during the third quarter appear to have slowed deterioration in the quarter for most banks with the exception of the median large bank where the Underperforming Loan Ratio continues the steady rise that started in 4Q22.
Chart 1

It’s likely, particularly within the sub-$10 billion cohorts, that the levels of underperforming assets are understated. Historically, smaller banks are slower to project loans that are likely to manifest debt service coverage ratios (DSCR) of less than 1 when these loans renew in a higher rate environment. Should mid-term rates tick up or remain higher for longer, the abating trends will likely reaccelerate as banks renew loans at higher rates.
Charts 1 through 3 show the stock and flow of underperforming ComRe loans by 3 asset size cohorts: Banks less than $1B in Assets (266 banks), Banks $1B to $10B in Assets (319 banks), and Banks over $10B in Assets (120 banks).
The charts are designed to visualize not only the central tenancies of levels and trends in underperforming ComRe loans but also the developing conditions in the extremities of the cohorts. For example, the upper dots show the conditions in the banks occupying the 80th worst percentile rank within each respective cohort.
Chart 2

Chart 3

- See Cybiont’s Granular View of Bank Credit Quality for definitions and methods. ↩︎

Leave a Reply